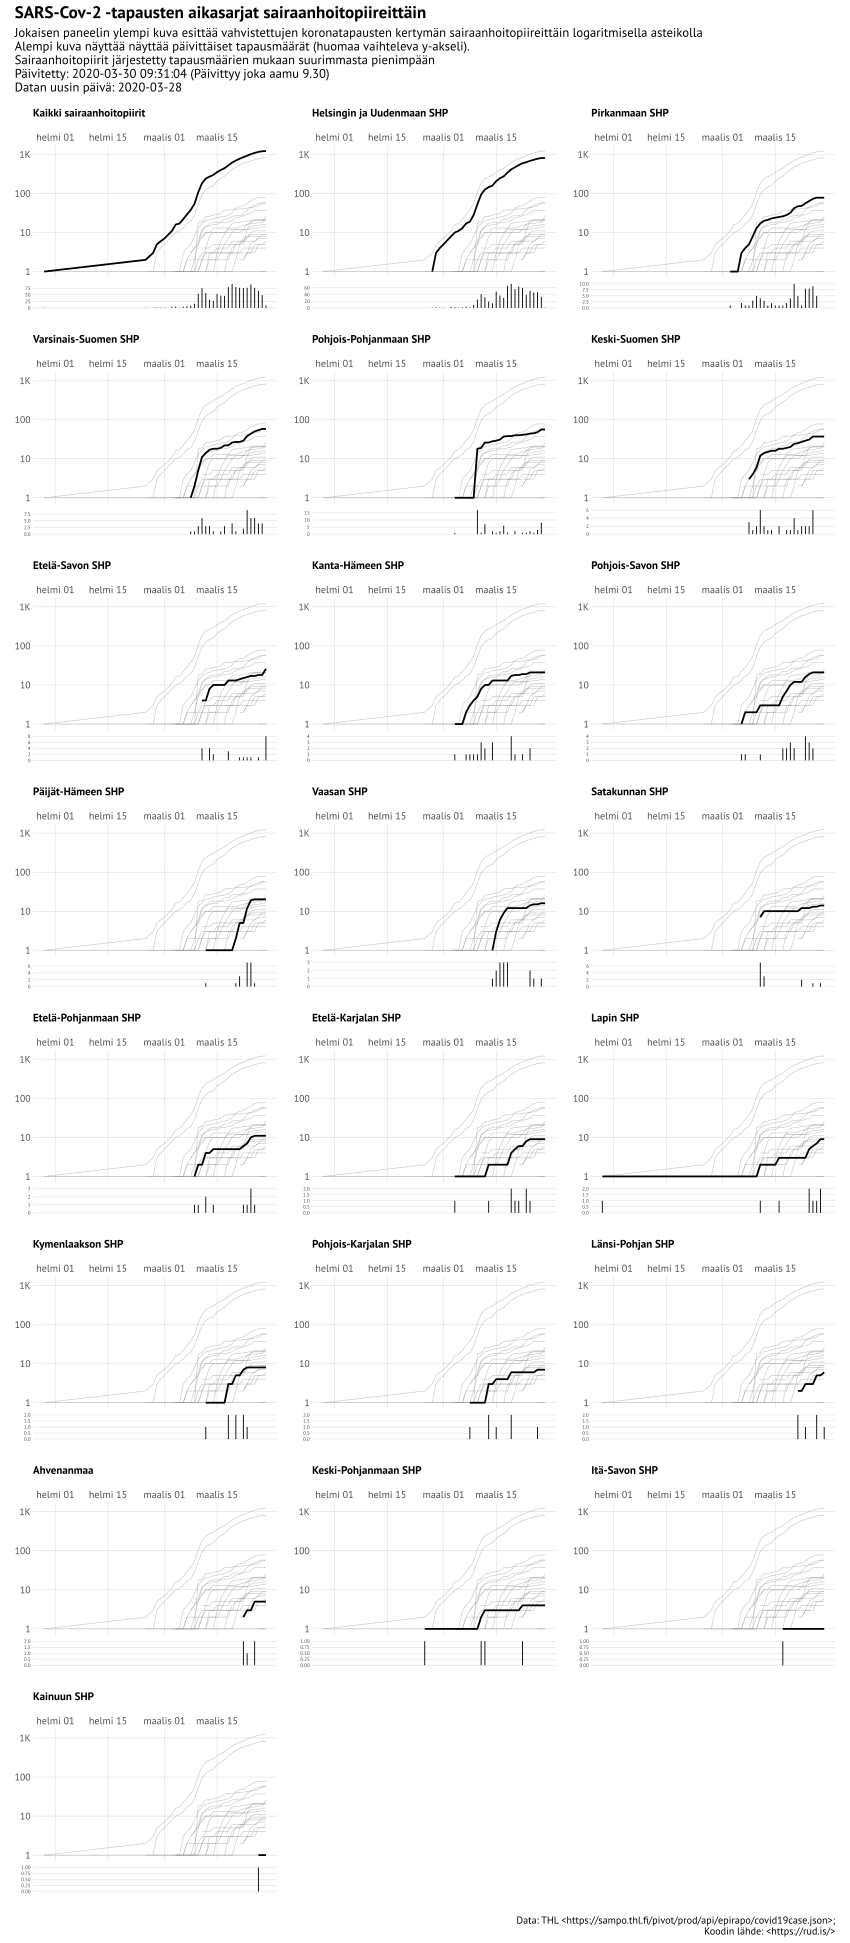
library (stringi)library (patchwork)library (hrbrthemes)library (tidyverse)library (jsonlite)<- "PT Sans" Sys.setlocale ("LC_ALL" , "fi_FI.utf8" )cols (Alue = col_character (),Aika = col_date (format = "" ),val = col_double ()-> cov_cols<- read_csv2 ("https://sampo.thl.fi/pivot/prod/fi/epirapo/covid19case/fact_epirapo_covid19case.csv?row=dateweek2020010120201231-443702L&column=hcd-444832#" , col_types = cov_cols)<- xdf_raw %>% # filter(!grepl("Kaikki", Alue)) %>% rename (date = Aika, shp = Alue, day_cases = val) %>% group_by (shp) %>% arrange (shp,date) %>% filter (! is.na (day_cases)) %>% mutate (total_cases = cumsum (day_cases))%>% filter (total_cases != 0 ) %>% arrange (shp,date) %>% group_by (shp, date) %>% arrange (date) %>% mutate (idx = 1 : n ()%>% ungroup () %>% arrange (shp, idx) -> gdf%>% group_by (shp) %>% filter (date == max (date)) %>% # last observation ungroup () %>% arrange (desc (total_cases)) %>% # largest to smallest pull (shp) %>% # make a combo graph for each shp map (~ {<- filter (gdf, shp == .x)<- filter (gdf, shp != .x)# log10 cumulative line ggplot (cur) + geom_path (data = rest, aes (date, total_cases, group = shp),color = ft_cols$ gray, size = 0.35 , alpha = 1 / 2 + geom_path (data = cur, aes (date, total_cases), size = 1 ) + scale_x_date (position = "top" ) + scale_y_log10 (breaks = c (1 , 10 , 100 , 1000 , 10000 ),label = c ("1" , "10" , "100" , "1K" , "10K" )+ labs (x = NULL , y = NULL , subtitle = .x) + # theme_ipsum_es(grid="XY", subtitle_family = font_es_bold, subtitle_face = "bold") + theme_ipsum_es (grid= "XY" , subtitle_family = fontname, base_family = fontname, subtitle_face = "bold" ) + theme (panel.spacing = unit (0 , "lines" )) + theme (panel.spacing.y = unit (0 , "lines" )) + theme (axis.text.x = element_text (size = 12 )) + theme (plot.margin = margin (10 , 10 , 6 , 10 )) -> gg2# individual day counts bars ggplot (cur) + geom_segment (aes (date, 0 , xend = date, yend = day_cases)) + scale_x_date (limits = range (gdf$ date)) + labs (x = NULL , y = NULL ) + # theme_ipsum_es(grid="Y", axis_text_size = 6) + theme_ipsum_es (grid= "Y" , axis_text_size = 6 , base_family = fontname) + theme (axis.text.x = element_blank ()) + theme (panel.spacing = unit (0 , "lines" )) + theme (panel.spacing.y = unit (0 , "lines" )) + theme (plot.margin = margin (0 , 10 , 18 , 10 )) -> gg3# combine them + gg3 + plot_layout (ncol = 1 ,heights = c (5 , 1 )-> gg_x<- "./shp.svg" file.create (tf1)# svglite::svglite(tf1, width = 14, height = 25) wrap_plots (gg_x, ncol = 3 ) + plot_annotation (title = "SARS-Cov-2 -tapausten aikasarjat sairaanhoitopiireittäin" ,subtitle = sprintf ("Jokaisen paneelin ylempi kuva esittää vahvistettujen koronatapausten kertymän sairaanhoitopiireittäin logaritmisella asteikolla \n Alempi kuva näyttää näyttää päivittäiset tapausmäärät (huomaa vaihteleva y-akseli). \n Sairaanhoitopiirit järjestetty tapausmäärien mukaan suurimmasta pienimpään \n Päivitetty: %s (Päivittyy joka aamu 9.30) \n Datan uusin päivä: %s" ,Sys.time (),max (gdf$ date)),caption = "Data: THL <https://sampo.thl.fi/pivot/prod/api/epirapo/covid19case.json>; \n Koodin lähde: <https://rud.is/>" ,theme = theme_minimal (base_family = fontname, base_size = 15 ) + theme (plot.title = element_text (face = "bold" , size = 20 ))-> ppggsave (filename = tf1, plot = pp, width = 14 , height = 32 ) :: svg_googlefonts (tf1, "PT Sans" , new_svgfile = "./shp-with-fonts.svg" )