Kela corona indicators and a web app on reimbursed medicine consumption

open data
kela
covid19
data
Tekijä

Markus Kainu

Julkaistu

13. joulukuuta 2020

The virus has troubled the world the whole year and does not seem to cease soon. There were plenty of Corona related dashboards and visualizations around in April/May, but it seems that the buzz has calmed down a bit. I bloggerd (in Finnish) about corona data api of Finnish Institute for Health and Welfare in March published a daily updating dashboard SARS-Cov-2 Timeline Trajectories: Health Districts in Finland based on their reliable api.

Corona has also affected what I do at work and we have created together with colleagues two separate resources for tracking the effect of corona on Kela benefits.

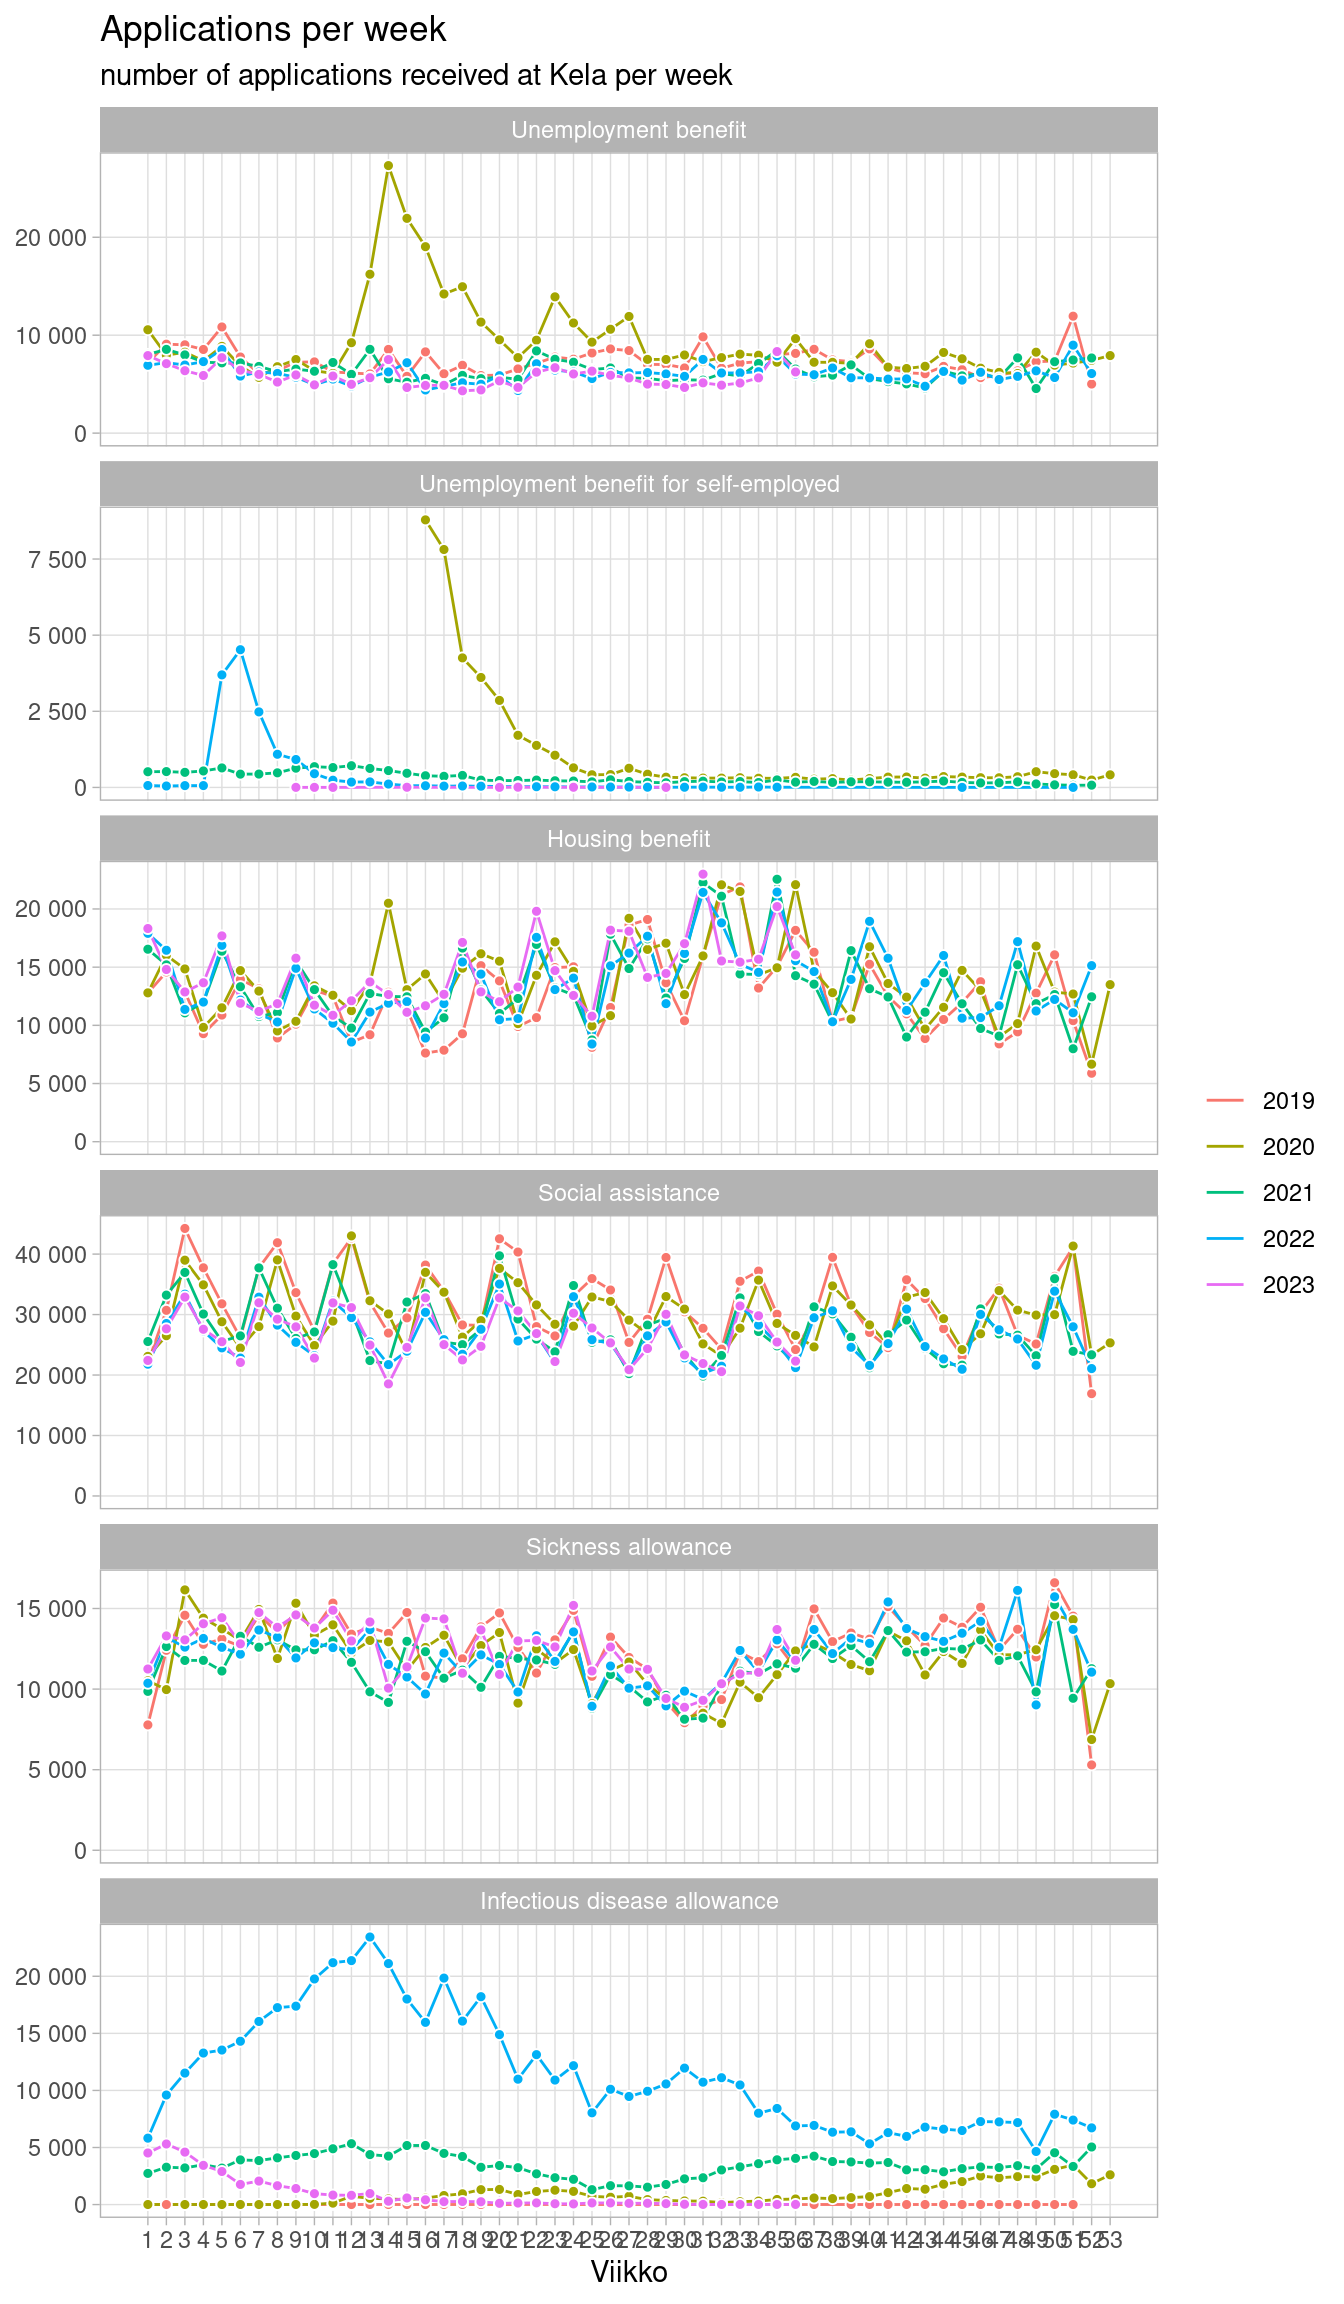
koronamittarit.kela.fi (corona indicators) provides data and analysis on several Kela benefits at daily, weekly and monthly resolutions in terms of number of applications, number of recipients and on the performance of Kela customer service. Site is refreshed every weekday at 10am.

Purchased prescription medicines in Finland- web app provides a dynamic access to information on reimbursable prescription medicines in terms of costs, number of purchases and number of patients on a weekly basis in 2019 and 2020 at the national level as well as health district level.

Both application provide open data in addition to their simplistic analysis. Data on corona indicators is documented on the website (in Finnish only) and can be doanloaded from Github. Data from medicine app can be accessed also at Github.

There are examples on how to get started with the data both about corona indicators and medicine data. The easiest way to get started is to create an account in rstudio.cloud, copy the code snippets and begin to wonder! Below is one more example!

[/kode]
library(dplyr)
library(readr)
library(forcats)
cols(
  etuus = col_character(),
  vuosi = col_integer(),
  aikatyyppi = col_character(),
  kuukausi = col_integer(),
  viikko = col_integer(),
  paiva = col_date(),
  viikonpaiva = col_character(),
  alue = col_character(),
  ikaluokka = col_character(),
  sukupuoli = col_character(),
  saapuneet_hakemukset = col_double(),
  updated = col_datetime()
) -> data_cols

dat <- readr::read_csv("https://raw.githubusercontent.com/kelaresearchandanalytics/koronamittarit/master/docs/data/data_etuudet.csv", 
                       col_types = data_cols) %>% 
  # releveloidaan ikäluokka
  mutate(ikaluokka = factor(ikaluokka),
         ikaluokka = fct_relevel(ikaluokka, c("kaikki","alle 25"))) %>% 
  # Etuuksien järjestys
  mutate(etuus = factor(etuus, levels = c("Työttömyysturva",
                                          "Yrittäjien työmarkkinatuki",
                                          "Yleinen asumistuki", 
                                          "Perustoimeentulotuki",
                                          "Sairauspäiväraha",
                                          "Tartuntatautipäiväraha",
                                          "Epidemiatuki")),
         vuosi = factor(vuosi)) %>% 
  arrange(etuus,viikko,paiva)
head(dat)
# A tibble: 6 × 19
  etuus  vuosi aikatyyppi kuukausi viikko paiva      viikonpaiva alue  ikaluokka
  <fct>  <fct> <chr>         <int>  <int> <date>     <chr>       <chr> <fct>    
1 Tyött… 2020  paiva             1      1 2020-01-01 keskiviikko Koko… kaikki   
2 Tyött… 2020  paiva             1      1 2020-01-02 torstai     Koko… kaikki   
3 Tyött… 2020  paiva             1      1 2020-01-03 perjantai   Koko… kaikki   
4 Tyött… 2020  paiva             1      1 2020-01-04 lauantai    Koko… kaikki   
5 Tyött… 2020  paiva             1      1 2020-01-05 sunnuntai   Koko… kaikki   
6 Tyött… 2021  paiva             1      1 2021-01-04 maanantai   Koko… kaikki   
# ℹ 10 more variables: sukupuoli <chr>, saapuneet_hakemukset <dbl>, data <chr>,
#   saajat_kaikki <dbl>, saajat_uudet <dbl>, saajakotitaloudet_kaikki <dbl>,
#   saajakotitaloudet_uudet <dbl>, saajaruokakunnat_kaikki <dbl>,
#   saajaruokakunnat_uudet <dbl>, updated <dttm>
[/kode]
levels(dat$etuus)[levels(dat$etuus) == "Työttömyysturva"] <- "Unemployment benefit"
levels(dat$etuus)[levels(dat$etuus) == "Yrittäjien työmarkkinatuki"] <- "Unemployment benefit for self-employed"
levels(dat$etuus)[levels(dat$etuus) == "Yleinen asumistuki"] <- "Housing benefit"
levels(dat$etuus)[levels(dat$etuus) == "Perustoimeentulotuki"] <- "Social assistance"
levels(dat$etuus)[levels(dat$etuus) == "Sairauspäiväraha"] <- "Sickness allowance"
levels(dat$etuus)[levels(dat$etuus) == "Tartuntatautipäiväraha"] <- "Infectious disease allowance"
levels(dat$etuus)[levels(dat$etuus) == "Epidemiatuki"] <- "Temporary compensation due to an epidemic outbreak for basic social assistance clients"


library(ggplot2)
datplot <- dat %>% 
  dplyr::filter(aikatyyppi == "viikko",
         ikaluokka == "kaikki",
         sukupuoli == "kaikki",
         alue == "Koko Suomi") %>% 
  mutate(viikko = as.integer(viikko))

ggplot(datplot, 
       aes(x = viikko, 
           y = saapuneet_hakemukset, 
           color = vuosi, 
           fill = vuosi)) +
  geom_line() +
  geom_point(shape = 21, color = "white", size = 1.6,  show.legend = FALSE) +
  facet_wrap(~etuus, ncol = 1, scales = "free_y") +
  scale_x_continuous(breaks = 1:max(datplot$viikko)) +
        labs(fill = NULL, 
             color = NULL, 
             y = NULL,
             title = "Applications per week",
             subtitle = "number of applications received at Kela per week",
             x = "Viikko") +
  theme_light() +
        theme(legend.position = "right", 
              legend.direction = "vertical",
              panel.grid.minor = element_blank()) +
        scale_y_continuous(labels = function(x) format(x, big.mark = " ",
                                                       scientific = FALSE),
                           limits = c(0,NA))

Uudelleenkäyttö

Viittaus

BibTeX-viittaus:
@online{kainu2020,
  author = {Kainu, Markus and Kainu, Markus},
  title = {Kela corona indicators and a web app on reimbursed medicine
    consumption},
  date = {2020-12-13},
  url = {https://markuskainu.fi/posts/2020-12-13-kela_corona_indicators},
  langid = {fi}
}
Viitatkaa tähän teokseen seuraavasti:
Kainu, Markus, and Markus Kainu. 2020. “Kela corona indicators and a web app on reimbursed medicine consumption.” December 13, 2020. https://markuskainu.fi/posts/2020-12-13-kela_corona_indicators.