Just a quick technical post mainly for my future self. When I am next time googling with ggplot label with dataframe data.frame I will hopefully find this.
ggplot2 is a popular library for making static graphics in R. Functions such as geom_label or geom_text (as well as geom_sf_text, geom_sf_label and geom_text_repel & geom_label_repel from ggrepel-package) are neat tools for annotating plots with text. Most common case is to label series in line plot, add values on top of bar chart bars or adding the name and population of a region into a map.
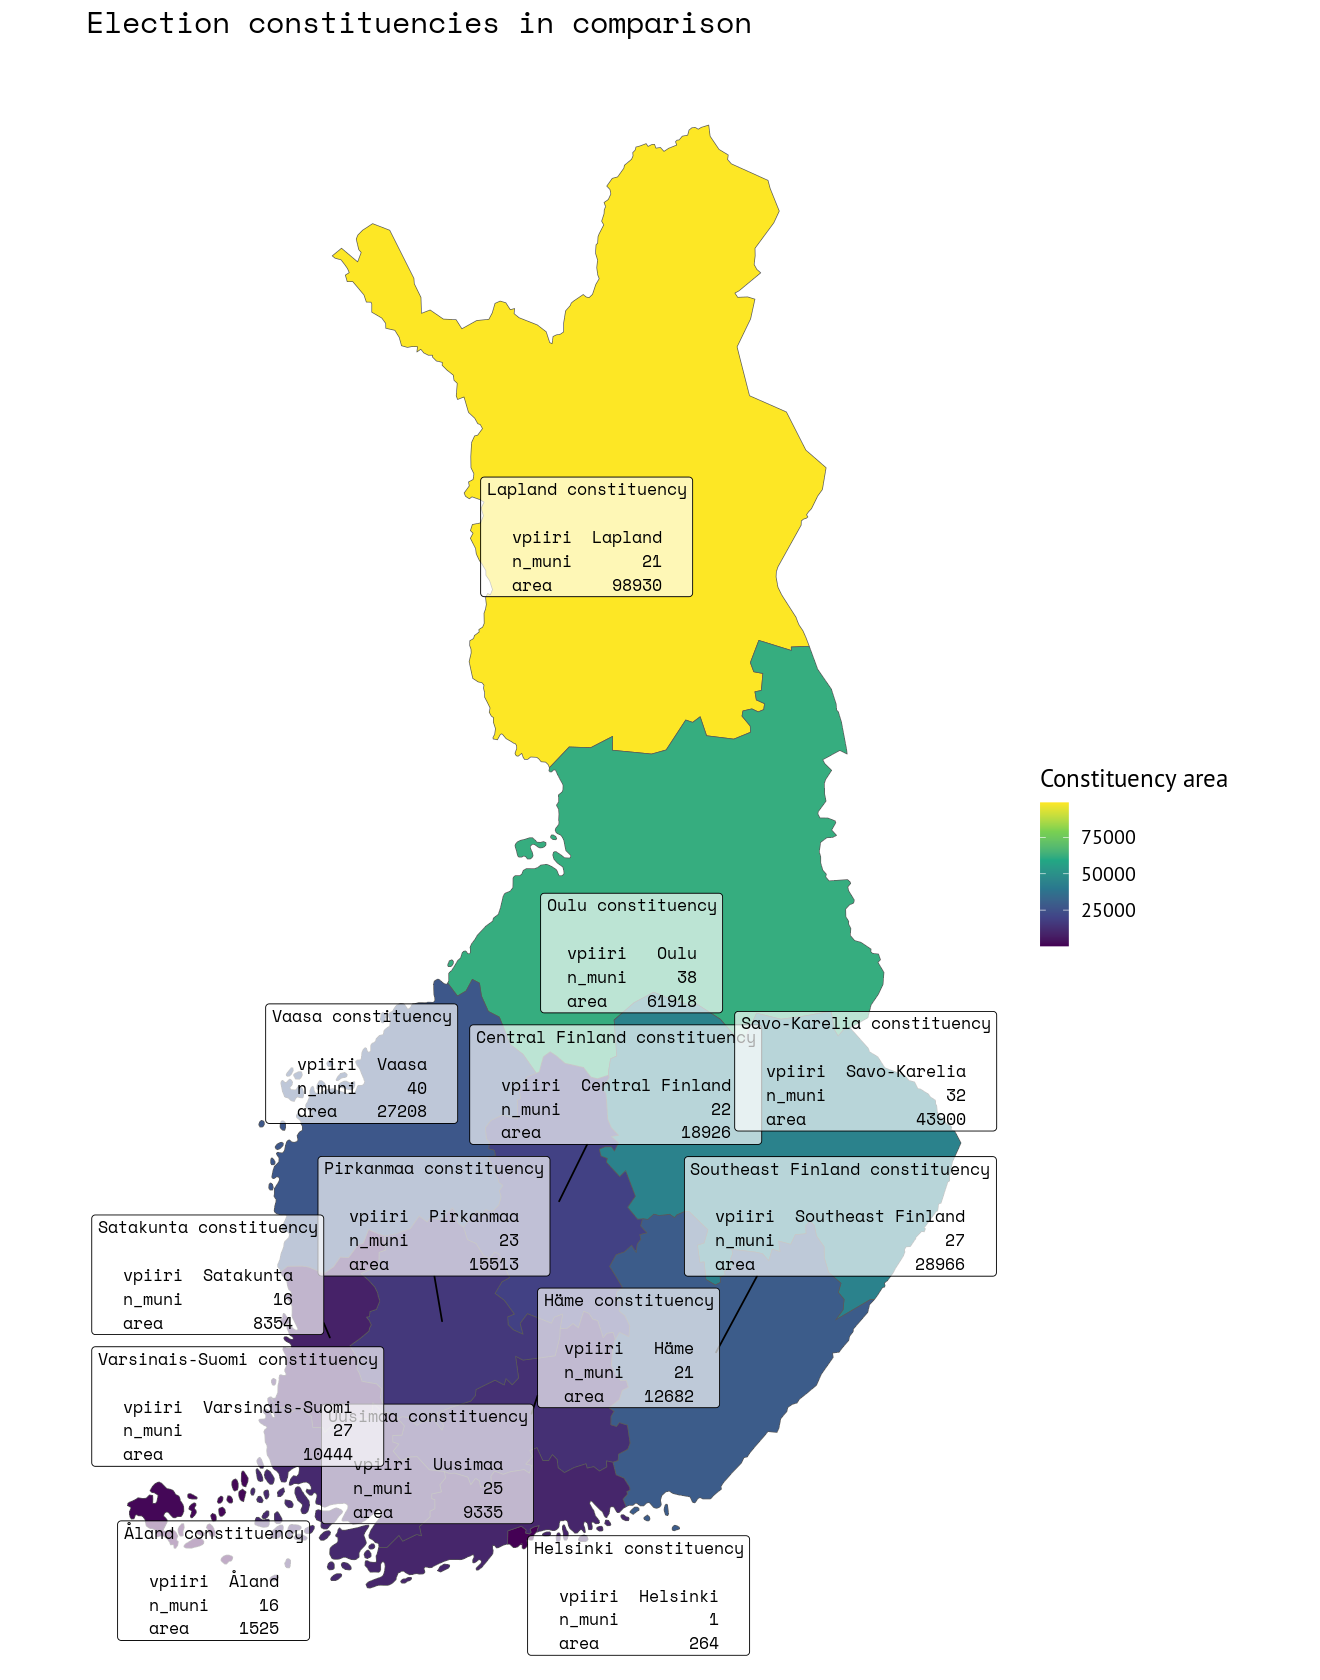
In past week I needed to create a map with a small table on top of each region. I am used to use leaflet-package and interactive maps like here Eduskuntavaalit 2019: Helsingin äänestysalueiden top 3 , but with growing pressures to make things accessible, I have switched back to static maps and simple alt-texts. Below is an example code on how to do one at the level of election constituencies in Finland so that it shows the name of the constituency, number of municipalities and the area of constituency.
[/kode]
library (dplyr)library (glue)library (ggplot2)library (tidyr)library (readr)library (geofi)library (sf)<- get_municipalities ()<- muni %>% group_by (vaalipiiri_name_en) %>% summarise (n_muni = n ())$ area <- as.integer (round (sf:: st_area (vaalipiiri)/ 1000000 ))print (vaalipiiri)
Simple feature collection with 13 features and 3 fields
Geometry type: GEOMETRY
Dimension:     XY
Bounding box:  xmin: 83747.59 ymin: 6637032 xmax: 732907.7 ymax: 7776431
Projected CRS: ETRS89 / TM35FIN(E,N)
# A tibble: 13 × 4
   vaalipiiri_name_en             n_muni                              geom  area
 * <chr>                           <int>                    <GEOMETRY [m]> <int>
 1 Central Finland constituency       22 POLYGON ((416178.3 6847939, 4139… 18926
 2 Helsinki constituency               1 MULTIPOLYGON (((402737.7 6680700…   264
 3 Häme constituency                  21 POLYGON ((399519.5 6739515, 3940… 12682
 4 Lapland constituency               21 POLYGON ((388163.1 7285002, 3871… 98930
 5 Oulu constituency                  38 MULTIPOLYGON (((382095.7 7060309… 61918
 6 Pirkanmaa constituency             23 POLYGON ((329878.3 6763699, 3287… 15513
 7 Satakunta constituency             16 MULTIPOLYGON (((237353.5 6758229…  8354
 8 Savo-Karelia constituency          32 POLYGON ((549385.7 6881072, 5453… 43900
 9 Southeast Finland constituency     27 MULTIPOLYGON (((508037.2 6684114… 28966
10 Uusimaa constituency               25 MULTIPOLYGON (((300620.8 6644389…  9335
11 Vaasa constituency                 40 MULTIPOLYGON (((225346.6 6887072… 27208
12 Varsinais-Suomi constituency       27 MULTIPOLYGON (((194643.4 6644558… 10444
13 Åland constituency                 16 MULTIPOLYGON (((113645.7 6681193…  1525
Next we need to create the small data frame for each constituency.
40 27208
[/kode]
<- function (x,padchar= " " ,padside= "right" , padplus = 2 ){:: str_pad (x, max (nchar (x))+ padplus, side= padside, pad= padchar)<- st_drop_geometry (vaalipiiri) %>% setNames (c ("vpiiri" ,"n_muni" ,"area" ))<- unique (vaalipiiri_df$ vpiiri)<- list ()for (i in seq_along (vpt)){<- tibble (vaalipiiri = vpt[i],label = vaalipiiri_df %>% filter (vpiiri == vpt[i]) %>% mutate_all (as.character) %>% mutate (vpiiri = gsub (" constituency| maakunnan" , "" , vpiiri)) %>% pivot_longer (1 : 3 ) %>% mutate (name = pad_same_length_plus_2 (name, padplus = 0 ),value = pad_same_length_plus_2 (value, padside = "left" , padplus = 0 )) %>% setNames (c (" " ," " )) %>% format_tsv () %>% sub (" \n $" , "" , .)) %>% mutate (label = paste0 (vaalipiiri," \n " ,label))<- tmpdat<- do.call (bind_rows, vplista)<- left_join (vaalipiiri,label_data, by = c ("vaalipiiri_name_en" = "vaalipiiri" ))
[/kode]
ggplot (mapdata2, aes (fill = area,label = label)) + labs (title = "Election constituencies in comparison" ,fill = "Constituency area" ) + geom_sf () + :: geom_label_repel (data = mapdata2 %>% :: st_set_geometry (NULL ) %>% bind_cols (mapdata2 %>% :: st_centroid () %>% :: st_coordinates () %>% as_tibble ()),aes (label = label,x = X,y = Y#, fill = alpha ("white" , 2 / 3 ),color = "black" ,family = "Space Mono" ,size = 3.5 ,max.overlaps = 35 ) + scale_fill_viridis_c ()
Viittaus BibTeX-viittaus:
@online{kainu2021,
  author = {Kainu, Markus},
  title = {Labelling plot using data.frame in ggplot2},
  date = {2021-04-30},
  url = {https://markuskainu.fi/posts/},
  langid = {fi}
}
Viitatkaa tähän teokseen seuraavasti:
Kainu, Markus. 2021.
“Labelling plot using data.frame in
ggplot2.” April 30, 2021.
https://markuskainu.fi/posts/ .